Robin
Penultimate Amazing
- Joined
- Apr 29, 2004
- Messages
- 14,971
Well I have probably spent more time on this than it really merits. So my last contribution will be to suggest a way of detecting whether an anticipation artifact is causing an apparent "presentiment" effect. It turns out to be a little like unscrambling an egg.
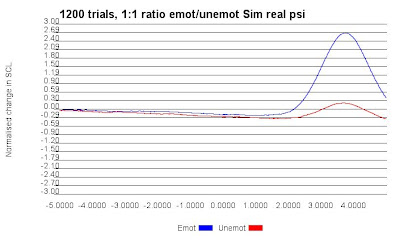
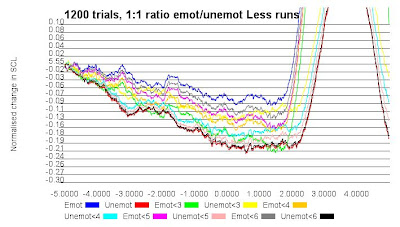
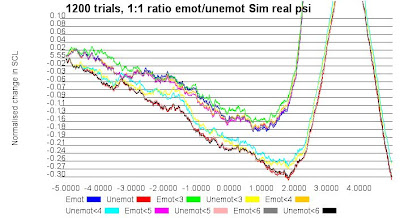
First start with two similar results, the first caused by an anticipation artifact with the random number generated at 0. The second is a simulation of what presentiment might really look like, with the assumption that about 3/4 of people will have varying degrees of presentiment from tiny to slight and variable targets:
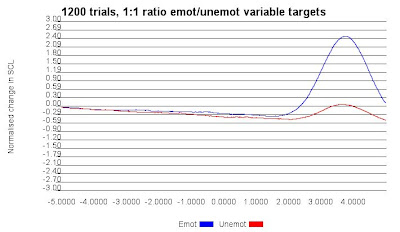
The underlying data looks pretty much the same in each case. Any analysis done by Dean Radin and others make invalid assumptions about this effect and so their tests are ineffective. The trends are lost in other trends and noise:
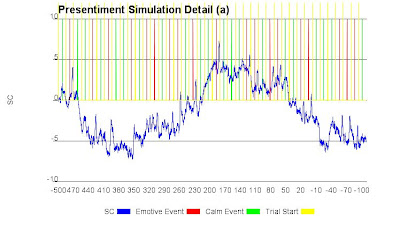
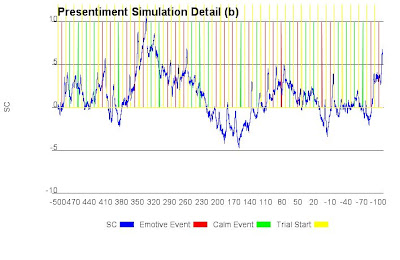
But the anticipation effect depends upon the effect of local maxima and minima, not of absolute value, but of gradient (otherwise the lines would be parallel, not diverging).
So my strategy is to produce a series of aggregates. The first aggregate leaves out emotive trials following runs of more than 5 calm, and calm trials following runs of more than 5 emotive trials. The next aggregate does the same, but with runs of 4 and so on.
This should progressively collapse the gap between the two trends and in my simulation it does - even reversing it:
Whereas in the simulated "real" presentiment data the gap remains more or less the same:
And graphing the average gap should bear this out.
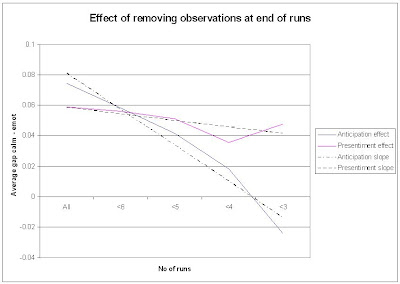
Naturally in real life this distinction may not be so clear cut, I could certainly have underestimated the amount of noise to add. On the other hand noise increases the probability that the two trends will diverge with no other artifact present.
First start with two similar results, the first caused by an anticipation artifact with the random number generated at 0. The second is a simulation of what presentiment might really look like, with the assumption that about 3/4 of people will have varying degrees of presentiment from tiny to slight and variable targets:
So my strategy is to produce a series of aggregates. The first aggregate leaves out emotive trials following runs of more than 5 calm, and calm trials following runs of more than 5 emotive trials. The next aggregate does the same, but with runs of 4 and so on.
This should progressively collapse the gap between the two trends and in my simulation it does - even reversing it:
Whereas in the simulated "real" presentiment data the gap remains more or less the same:
And graphing the average gap should bear this out.
Naturally in real life this distinction may not be so clear cut, I could certainly have underestimated the amount of noise to add. On the other hand noise increases the probability that the two trends will diverge with no other artifact present.
Last edited:
")