Moderated Global Warming Discussion

Status
Not open for further replies.
Carbon 14 is made in the upper atmosphere. It has a half life of a few thousand years. Carbon that is in plants and animals would have some of this carbon 14 in them. However coal, which has been underground for millions of years would not have any of this carbon 14.

See this link for more information http://en.wikipedia.org/wiki/Carbon-14

well,... considering half-lifes, it is probably better to say "... does not have near as much of this carbon 14, as it should have" but this is only part of the story. To many researchers, the C12/13 ratios are the first part of the story.

C14 exists in a 1::1012 ratio with these other Carbon ratios; plants have a preference for the lightest isotopes of carbon, thus in plants we have a concentration of C12 vs C13.
 
This is basic chart spinning. The values on the left (temperature) and right (CO2 emissions) have no correlation. This is basically two different charts that are overlaid and don’t correspond to anything in relation to each other (other tan dates).

The Min and Max values for temperature are 6.84 and 10.82. But for the graph, they use 4 and 18. And the 6.84 is a single anomaly. Other than that, all of the temperatures are between 7 and 11. Then the zero point CO2 emissions are set arbitrarily at 4 degrees. For no reason. And extended up to 18 degrees, for no reason.

Changing the left and right ranges is an easy way to make graphs display whatever you want. Imaging if the right-side CO2 emissions range staid the same, but the range for the temperature was changed to 0-100, or even 0-1000. The line for CO2 would not change, but the temperature would be essentially a solid straight line.

In evaluating such a graph, you have to question those ranges and why they are being used. In this case, there is no reason to use 4 to 18 for the temperature. It should be 6 to 11, or probably 7 to 11. So you should suspect propaganda right away.

The other issue is where the line for CO2 emissions is placed. There is a long period of zero emissions. If you want to correlate emissions to temperature, it should be at an average temperature during the time of zero emissions, not arbitrarily placed equivalent to several degrees below any temperature that has ever happened.

I got the temperature data from the web site listed as the source on the chart. I got CO2 emissions data from http://www.mr-riordan.com/apes/handouts/week10/molnar24.html. This charts the same as what is in the chart, but is different units.

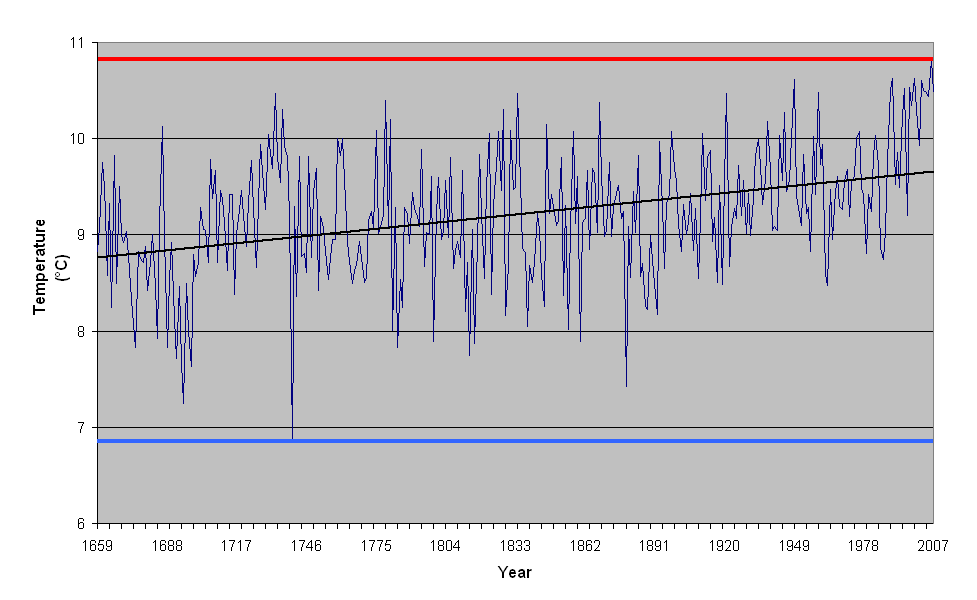
So, here is the real picture:


The scratchy blue lines are yearly average temperatures. The dark black is an 11 year average (including 5 years before and after). The green line represents the average temperature from 1660 to 1946 (when the big CO2 emissions started). The range is based on the yearly average temperatures, 7 to 11 (with only one year dropping slightly below that range).

The think dark red line (that you can hardly see) is the average yearly CO2 emissions. The bold red line is the 11 year average. These lines are postioned to so that the zero years correspond to the average temperature during the zero years (more or less: 1660 to 1946 ). The big problem is where to set the maximum for the CO2 emissions line. It could be set smaller or larger based on any number of criteria. I chose to set it so that the maximum CO2 emission equals the maximum temperature. Probably not a good method for a realistic percentage comparison, but I think it works well for identifying correlation.

This is the real graph of the data for purposes of identifying correlation. Make of it what you will.
 
He was here once. Banned for not being able to be civil.

He still haunts a few forums I frequent, strangely enough one dedicated to Australian Rules Football. Apparently he has a web crawler looking for wherever his links get posted or his name gets mentioned. I call him Beeteljuice, because if you say his name three times on a forum he magically appears. A few weeks ago he was posting constantly for well over 16 hours, I suspect he might be fuelling his paranoid conspiracy theories with more than just coffee, if ya know what I mean.
 
There was always going to be a point, as resources dwindle and the frequency of expensive natural disasters started to go up, where the voices of industries that stand to lose a lot when climate change was properly addressed start to get overpowered by those who stand to lose a lot more by not doing so.

And, y’know, if I was a clever, forward-thinking billionaire on the former side who was noticing this and starting to wonder if I could be held liable for anything when the tide turned and things started to get a bit real, I might start to lay the groundwork for a wee bit of an injury time reverse-ferret. Build myself a framing narrative of the good sceptical corporate citizen making sure we didn’t do anything rash, but nobly accepting they were wrong now that they’ve invested in looking properly at the data…
 
Oh, and a scale devised so as to cut off a significant amount of the data is soo much better?


CurtC’s graph covers an appropriate range of temperatures for what we are looking at, what value do you think needs to be in it that are not present?

OK, I just downloaded the data, smoothed it (averaged each point with the data from the previous ten years to the subsequent ten years) and plotted that. Here it is:

[qimg]http://i164.photobucket.com/albums/u27/kikapurider/Climate.png[/qimg]

The data on the left is below the scale, probably due to the Little Ice Age. I'm not sure about the bump in the early 1700s. But recent data sure does look like the CO2 graph.
 
The other issue is where the line for CO2 emissions is placed. There is a long period of zero emissions. If you want to correlate emissions to temperature, it should be at an average temperature during the time of zero emissions, not arbitrarily placed equivalent to several degrees below any temperature that has ever happened.

CO2 emissions don’t belong there at all. Temperatures respond in a logarithmic fashion to the amount of CO2 in the atmosphere meaning even if you plot CO2 in PPM you need to put it on a logarithmic scale to compare it to temperature. Emissions themselves influence CO2 concentrations, obviously, but just looking at a chart of raw CO2 emissions doesn’t get you anywhere close to CO2 concentrations.

Even if you look at concentrations and adjust for the logarithm nature of their impact on temperatures, temp lags CO2 changes by ~20-30 years, there is another important greenhouse gas (Methane) and there is a major cooling factor in the form of aerosols and at least 1 cyclical pattern that can impact trends over a 20 year time scale (ENSO).

When the all these factors and their real behaviour are considered climate models reproduce global temperatures quite reliably (but are less reliable at regional scales)

The think dark red line (that you can hardly see) is the average yearly CO2 emissions. The bold red line is the 11 year average. These lines are postioned to so that the zero years correspond to the average temperature during the zero years (more or less: 1660 to 1946 ). .

I’d discard any readings before 1710 when the mercury in glass thermometer was invented, it simply wasn’t possible to get accurate temperature readings before this. Even after that the methodology for taking temperature readings are not standardized for at least another 100 years
 
The daft thing is that the very industries funding the denialist movement are also some of the biggest providers for renewable research. It's really just a delaying tactic giving them time to develop the technologies to make money out of renewables.

The latest fad of trying to hype the costs of carbon taxation completely avoid discussion of the 'green economy' of recycling, renewable energy, construction of smart grids, etc. (see AA Alfies thread about Australias Carbon Tax...). The green economy can be a major money spinner and boost to economies. Just to look at the UK, the government has been incredibly shortsighted in refusing any option to try and tap the energy of the tidal flow of the Bristol Channel. A full-blown barrage would probably be too much to bring in immediately because of the ecological damage to breeding grounds, etc. It wouldn't be beyond us to build 3 or 4 tidal lagoons with the possibility of a full barrage in 20 years when a better understanding on the shore conditions is developed. The funding would feed back into the economy because the money doesn't just disappear, it funds companies, employment, training, supply chains, etc.
 
I'm sorry but, really? THIS is the reaction to this news?

How is this surprising? The idea that scientific concensus equals truth is only of marginal value, and only to those who don't have any expertise in the field. As soon as you get any expertise at all, you are obligated (if you're a scientist) to form your own opinions, based on the data. Some people are going to disagree, holding that some data is more significant than other data. In something as complex as climate disagreement is inevitable--look at how long it took to prove that an impact ended the Mesozoic era, and that was pretty simple by comparison! Gerta Keller is STILL arguing against it--and as long as she presents data to support her arguments, she's still a scientist. Similarly, this guy was never any less of a scientist for bucking the concensus. He believed the data said one thing, so he held that conclusion. When the data proved that conclusion wrong, he followed the data. THAT'S WHAT SCIENTISTS DO.

This isn't a demonstration of ego or arrogance--this is a foundational principle of science, without which the entire enterprise collapses. Every scientist is obligated to formulate their own opinions in the areas they study. Concensus means very, very little in science, and means nothing whenever any data are on the table. That's the main reason we can argue that science will eventually be right: there are simply too many people, holding too many opinions, for any rigid orthidoxy to take hold, and as long as we all accept that all conclusions must be supported by data even the people who are wrong can teach us new things.

Besides, what's the other option? Argument ad populum? Where does the concesus come from in such a view? If everyone who disagrees with the majority is wrong, how will we decide what the majority thinks? At that point science is no longer about fearlessly examining the data to discover new facts about reality--it will have become nothing more than a high-school popularity contest. Instead of asking "Is this true?" scientists would ask "Do other people think this is true?", which would make them not scientists at all.

This man should be applauded. Not because he stood up to the concensus, and not because he eventually came to agree with them; rather, he should be applauded because he is demonstrating the very roots of how science works.
 
Apparently McIntyre is not too happy to be listed as an author. He was only asked to help out at the last minute, and really knows nothing much about the paper at all. That is a coded statement that he wants nothing to do with the paper, since he knows it is a mess. McIntyre's form has been to complain much, but commit as little as possible to the formal scientific process, while giving all his friends missives a free pass. Now Watts has gone and roped him into a paper he doesn't want to be associated with.

By doing this Watts demonstrates how alien he is to the academic world and its behavioural norms. Personally, I doubt he ever learnt how to write an essay let alone an academic paper.

Like the CET graph, this will never die, of course. Nor will Watts's dedication to the UHI answer nor McIntyre's obsession with the hockey-stick. It's as if we've been transported a decade into the past and everything that's happened since has turned out to be a troubled dream. Sombre pronouncements that the world had entered a long-term cooling phase (by Piers Corbyn, among others) were so much wish-fulfilment or the product of a few scraps of undigested meat.

Monckton's sudden an inexplicable prominence should have been the give-away. That was just too weird for the waking world.
 
We would need CO2 content of the atmosphere since the little ice age to regard whether the recent increase (150 years) is strictly man made, or the result of warming as opposed to being the cause.

We create twice as much CO2 as accumulates in the atmosphere, so yes, we are the cause. The only question is where the rest of it goes, and we know that most of it goes into the ocean (causing a whole different problem).
 
I'm sorry but, really? THIS is the reaction to this news?

How is this surprising? The idea that scientific concensus equals truth is only of marginal value, and only to those who don't have any expertise in the field. As soon as you get any expertise at all, you are obligated (if you're a scientist) to form your own opinions, based on the data. Some people are going to disagree, holding that some data is more significant than other data. In something as complex as climate disagreement is inevitable--look at how long it took to prove that an impact ended the Mesozoic era, and that was pretty simple by comparison! Gerta Keller is STILL arguing against it--and as long as she presents data to support her arguments, she's still a scientist. Similarly, this guy was never any less of a scientist for bucking the concensus. He believed the data said one thing, so he held that conclusion. When the data proved that conclusion wrong, he followed the data. THAT'S WHAT SCIENTISTS DO.

This isn't a demonstration of ego or arrogance--this is a foundational principle of science, without which the entire enterprise collapses. Every scientist is obligated to formulate their own opinions in the areas they study. Concensus means very, very little in science, and means nothing whenever any data are on the table. That's the main reason we can argue that science will eventually be right: there are simply too many people, holding too many opinions, for any rigid orthidoxy to take hold, and as long as we all accept that all conclusions must be supported by data even the people who are wrong can teach us new things.

Besides, what's the other option? Argument ad populum? Where does the concesus come from in such a view? If everyone who disagrees with the majority is wrong, how will we decide what the majority thinks? At that point science is no longer about fearlessly examining the data to discover new facts about reality--it will have become nothing more than a high-school popularity contest. Instead of asking "Is this true?" scientists would ask "Do other people think this is true?", which would make them not scientists at all.

This man should be applauded. Not because he stood up to the concensus, and not because he eventually came to agree with them; rather, he should be applauded because he is demonstrating the very roots of how science works.

Well.... to play devil's advocate here.

The problem I think a lot of people have isn't that he was fact checking... it was that he was fact checking something that was already checked multiple times and his data came back almost exactly the same as the previous fact checking efforts.

It's sort of like someone saying "Hey, I don't believe Special Relativity is accurate" even though it has been tested and validated many many times. While one person is standing there saying "I don't believe Special Relativity is accurate" everyone else is moving on. Of course the rest of the scientific community is going to see this anti-Special Relativity guy as a Luddite.

And then, when this guy does all his calculations and then decides that "oh, well I guess that Eisenstein was on to something, I just proved his work is in fact valid" I think many people are going to see him as a glory hound or a hack... or both.

There comes a point when there is enough evidence that science needs to move on and accept that there is conclusive evidence for a given theory. If that were not the case we would still be discussing whether the Earth is flat.

Personally, I feel it's rather arrogant to fact check a large percentage of the scientific community on something they have already come to a consensus on.... then after that fact checking he comes back and says "now it's right because I checked it."

No one is saying scientists shouldn't double check their work. It's just that there is a time to do that and that time is well past in the climate change argument.
 
I am going to guess that temperatures in central England owe much more to the presence and stability of the Gulf Stream than anything else.

It owes more to the position of the summer Jet Stream than anything else (something we've been rather brutally reminded of this year).

If the global climate warms and the Gulf Stream stops or shifts, then the temps on this graph will nosedive.

The effect does tend to be exaggerated, except perhaps for Scotland and Norway. During the summer it has little impact and the simple presence of the Atlantic up-wind moderates winter temperatures. Central England actually gets as much weather from the Bay of Biscay as it does from the north Atlantic.
 
Is this evidence against global warming? Or some sort of scam?

It's an example of a zombie argument - dead but won't lie down.

How do I use the baloney detection kit against this?

There's an excellent book called How To Lie With Statistics which has a lot of good stuff about graphs and what to watch out for (or utilise yourself, for fun and profit).

When presented with a graph ask yourself what is this a graph of. Charlatans will often talk about something then put up a graph, and it's easy to assume that the graph is there because it's relevant. Often it's not. Technically, it's an example of the bait-and-switch technique.
 
The inability to tell the difference between local and global temperatures is "pretty damning evidence" for the ignorance of the author.

Let's not rule out duplicity. There's more than enough evidence in that picture to make a case for it.

For instance, the caption declares that 1946 was the start-point of an accelerating emission rate when it's clear that 1932 was the start-point. Compare the periods 1932-1948 and 1904-1928, both of which contained a World War and start from an economic slump; the former is more rapid than the latter. 1929 and 1946 cannot be regarded as representative years for any long-term trend. Not honestly, anyway.

Over half of the cumulative CO2 emissions of the Industrial Age have occurred since 1976. Makes you think.
 
not_so_new said:
Personally, I feel it's rather arrogant to fact check a large percentage of the scientific community on something they have already come to a consensus on.... then after that fact checking he comes back and says "now it's right because I checked it."
Than you're wrong.

I'm sorry, but there's no other way to interpret it. A scientist who relies on the opinions of others in areas they are expressing professional opinions on is not a scientist. The only thing that should matter to a scientist is the data--not what other people think of the data. Who knows? They may well all be wrong. Having people constantly fact-check is what keeps us honest.

Take, for example, uniformitarianism. It dominated the scientific community for two centuries. It was so widely held that the term "consensus" doesn't really apply--no one thought to challenge it, there were no other options (once Catastraphism was shown to be deeply flawed, anyway). Yet along came the Alvarez team, and suddenly uniformitarianism needs to be re-thought from the ground up. One of the foundational theories of several schools of thought, which had been fact-checked by so many scientists that they no longer realized they were doing it, was shown to be flawed because someone had the courage to fight (and it WAS a fight) the majority of the scientific community.

Had the Alvarez team followed the advice given thus far in this thread, they'd have meekly concluded that the K/Pg event took millions of years, because that's what the consensus would have dictated. And they'd have been dead wrong.

Again, I'm not saying that this guy is right, wrong, or indifferent. I'm saying that his METHODS are sound, and in fact are the only way for science to progress.

And there is NO point at which a scientist should stop checking ideas they think need checking. Science isn't some monolythic entity, and it certainly doesn't move forward as a cohesive whole. It's a mass of individuals all moving in different directions, with the net result being the expansion of our knowledge. Don't think of science as an army marching forward, think of it as a glacier. In a glacier, individuals flows can be in numerous directions--but the net result is outward motion from the center. We're the same. Sure, some scientists will move backward--they'll start believing guano-crazy garbage like Creationism or Deluge Geology or the like. But the apparently random motion of individuals keeps pushing the boundaries of our knowledge further and further outward.

Think we should constrain it? Try constraining a glacier sometime. It doesn't work, you'll waste a huge amount of effort, and in the end the wreckage of your attempt will be integrated into the system you tried to limit.

It's a natural consequence of what I just said that other researchers certainly will--and SHOULD--be working on solving the problems this one only now accepts as valid. They're not him, they haven't seen the same dataset as him (or he the same dataset as they), and they're free to move in the direction they see fit as well. I'm not saying we should be constrained to the speed of the slowest learner. I'm saying that constraints of any kind are detrimental in the short term and futile in the long term--be they tying researchers to the consensus, or demanding that everyone wait for the slowest members to catch up.
 
I'm a bit confused about the curved line versus straight line thing.... Look, here is another graph taken from the wiki:
SOURCE: http://en.wikipedia.org/wiki/Central_England_temperature
CET_Full_Temperature_Yearly.png


This graph has the proper temperature variables 7-11, and still spans back to the 1600s. Yet clearly the regression line is vastly more slanted than in the other graph.

I guess that means the previous graph with the green line was actually COMPLETELY arbitrary??
EDIT: OK, looking closely the two lines ARE the same. I guess it just looks less slanted because it is 'zoomed out' (showing temperatures from 4-18, as opposed to 7-11).

EDIT: OK, is there something weird going on with the "years" axis? Notice in the previous graph they only showed every 7th year. Could they perhaps be omitting certain years to further manipulate the data?? o-0
 
Last edited:
I guess that means the previous graph with the green line was actually COMPLETELY arbitrary??
The green line in the previous graph was COMPLETELY wrong because
  • central England temperatures do not linearly depend on CO2 emissions.
    They do not really depend on emissions at all - they depend (non-linearly) on the CO2 concentration.
  • the graph data when properly plotted by itself shows that a straight line is wrong.
An example: Look at the population of the Earth using the same date range. Would you draw a regression line through it?
I would not because
  • The population of the Earth does not increase linearly (the "physics" behind the graph).
  • The graph would make this non-linear trend obvious.
 
Than you're wrong.

I'm sorry, but there's no other way to interpret it. A scientist who relies on the opinions of others in areas they are expressing professional opinions on is not a scientist. The only thing that should matter to a scientist is the data--not what other people think of the data. Who knows? They may well all be wrong. Having people constantly fact-check is what keeps us honest.

<snip some very valid points>

I don't disagree with your points at all. I strongly encourage science to keep up the pressure by fact checking and self correction. In that we agree strongly.

But using your example, what toppled uniformitarianism? Alvarez found evidence that disproved the theory. That is exactly how science should work. Evidence, evidence, evidence, it always trumps opinion and speculation.

That is NOT the case with Richard Muller. I don't know a lot about the guy but from what I see, he all but ignored the evidence. In fact he actively argued against the evidence, until HE ran the numbers. Then he made the startling revilation that.... the science was already sound and man made global warming is true.

:jaw-dropp

Again, I am NOT in ANY WAY saying that scientists should just go with the crowd. I am saying that, before a scientist makes a decision on something they should examine the available evidence (which I believe you are saying as well).

There was a mountain of evidence available to Muller yet he seemingly choose to ignore that evidence (very UN-scientifically).

In the end he didn't change anything like Alvarez, he just confirmed what a large body of the scientific community already knew and along the way he just so happened to changed his own preconceived bias. That doesn't make him a good scientist, quite to the contrary in fact.

Should he have fact checked the work of others? Sure thing, but he should have kept his mouth shut until he examined the evidence. In the end, when he did choose to examine the evidence he came up with what appears to be the exact same results. He could have saved a lot of time and possibly a good bit of confusion if he had just followed the science.

I just don't think he should be applauded for this at all.
 
Status
Not open for further replies.

Back
Top Bottom