I hypothesize that there is a 1 in 100 [chance] of an earthquake in a given year, how many years of no earthquakes would it take before I could be confident that 1:100 is not correct
The wording of your question implies that you want to test the "null" hypothesis that the annual risk of an earthquake occurring is 1% vs. the alternative hypothesis that the annual risk of an earthquake is less than 1%. You want to know how many consecutive earthquake-free years you would need to observe in order to confidently conclude that the true risk is less than 1%.
Your question can be answered by using Bayesian statistics. The precise answer will depend on how you formulate the alternative hypothesis. That is, if the alternative hypothesis is true—if the true risk is less than 1%—how plausible are various values for the true risk. Do you think all values less than 1% are equally plausible, or do you have, for instance, reason to believe that values closer to 1% are more likely to be true than values close to 0? I'll do the calculations for two such alternative hypotheses. In both cases the null hypothesis, H0, is the same: the annual risk, p, is .01. These two tests will be as follows:
Test 1 will be
H
0: p = .01 vs.
H
1: p < .01, with all values between 0 and .01 considered equally plausible (ie, uniformly distributed).
Test 2 will be
H
0: p = .01 vs.
H
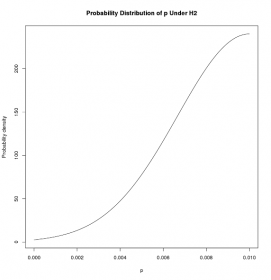
2: p < .01, with the plausibility of p decreasing as p gets further away from .01. We'll represent our belief about the plausibility of various values of p under H
2 by using the distribution depicted below, which is the portion of a normal distribution whose mean is .01 and whose standard deviation is .01/3, that lies between 0 and .01 (renormalized so that it integrates to 1).
The result of each test will be a Bayes factor (BF), defined as
BFA = P(D|HA) / P(D|H0) ,
where D is our data, the number of consecutive years, N, of no earthquakes; H
A will either be H
1 or H
2; and P stands for "probability." Let's say we choose N to be 300 years. Then, the expression P(D|H
1) would mean the probability of 300 consecutive years of no earthquakes under hypothesis H
1, and P(D|H
0) would mean the probability of 300 consecutive years of no earthquakes under the null hypothesis of 1% per year risk. Thus, the Bayes factor is the ratio of the probabilty of the data under two competing hypotheses about the annual earthquake risk. The larger the Bayes factor, the more the data favor the alternative hypothesis over the null. For example, BF=100 would mean that the data is 100 times more likely under the alternative possible than under the null.
The general formula for our Bayes factor is
where dbinom(0, N, p) is the binomial probability of 0 earthquakes in N consecutive years if the probability of an earthquake is p each year, and f
A(p) is the probability density function of p under the alternative hypothesis: uniform for H
1, and the half-normal density discussed above for H
2.
The denominator of BF
A, P(D|H
0), is easy to deteermine. The numerator, P(D|H
A), is more difficult. It is basically a weighted average of the probability of the data under the particular alternative hypothesis, where the weights are the values of f
A(p), the distribution of p under the appropriprate alternative hypothesis. Since both the uniform and half-normal distributions are continuous, we have to integrate to calculate this average.
Results for H1
The Bayes factors for N=300, 600, 900, and 1000 years are, respectively, 6.4, 69, 940, and 2314. Thus, for instance, observing 600 consective years without an earthquake favors the alternative hypothesis, that the true annual earthquake risk is less than 1%, over the null hypothesis, that the risk is 1%, by a factor of 69. That is, the data are 69 times more likely under the alternative hypothesis than the null. Recall that our assumption about the alternative hypothesis was that all values less than 1% are equally likely.
Results for H2
The Bayes factors for N=300, 600, 900, and 1000 years are, respectively, is 2.7, 12, 94, and 200. As in Test 1, the data favor the alternative hypothesis over the null, but not as strongly. This is because an observation of zero earthquakes, which suggests an annual risk close to zero, is less compatible with the half-normal distribution, which favors p's nearer to 1, than with the uniform distribution of Test 1, which considers all values of the risk less than .01 equally likely.
So, the bottom line is that you can get strong evidence against the null that the annual risk is 1% with serveral hundred years of data consisting of no earthquakes. How many years of data depends on your beliefs about the annual risk of an earthquake under the hypothesis that the risk is less than 1%.
I hope that was understandable.

")

